 |
pulsatrix
|
|
pulsatrix
|
Cascading waterfall chart from a baseline to a prediction, for local attribution. More...
#include "pulsatrix/attribution.hpp"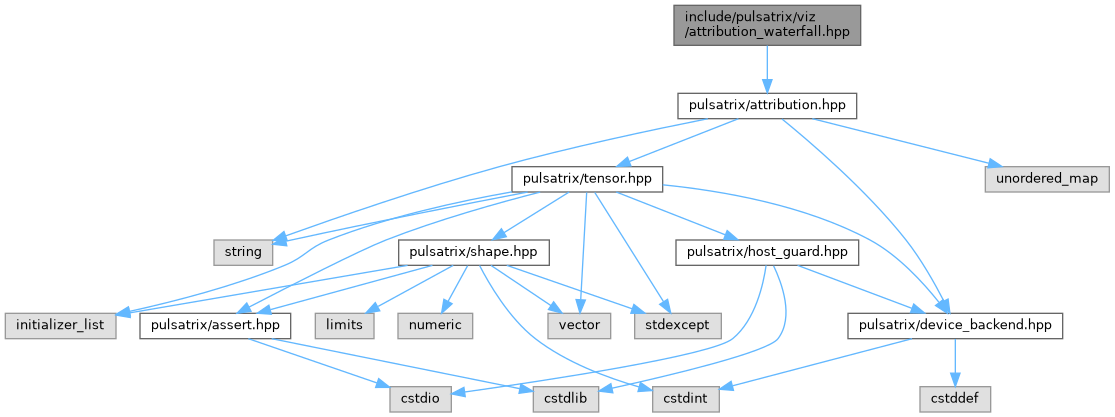
Go to the source code of this file.
Classes | |
| class | pulsatrix::AttributionWaterfallChart |
| Draws a waterfall chart cascading from baseline_value to the final prediction (hc_information_visualization.md SS5: "correct for local explanation with
directional attribution... bars cascade from base rate to prediction; color
encodes direction; length encodes magnitude"). This is the one bar chart in this module that legitimately does not start at zero – Tufte's lie-factor rule is satisfied relative to baseline_value, the meaningful reference point, not zero. More... | |
Namespaces | |
| namespace | pulsatrix |
Cascading waterfall chart from a baseline to a prediction, for local attribution.
 1.9.8
1.9.8