 |
pulsatrix
|
|
pulsatrix
|
Pure Attribution/Dataset -> plot-ready-array transforms (no ImGui/ImPlot include). More...
#include <cstdint>#include <string>#include <vector>#include "pulsatrix/attribution.hpp"#include "pulsatrix/circuit_graph.hpp"#include "pulsatrix/dataset.hpp"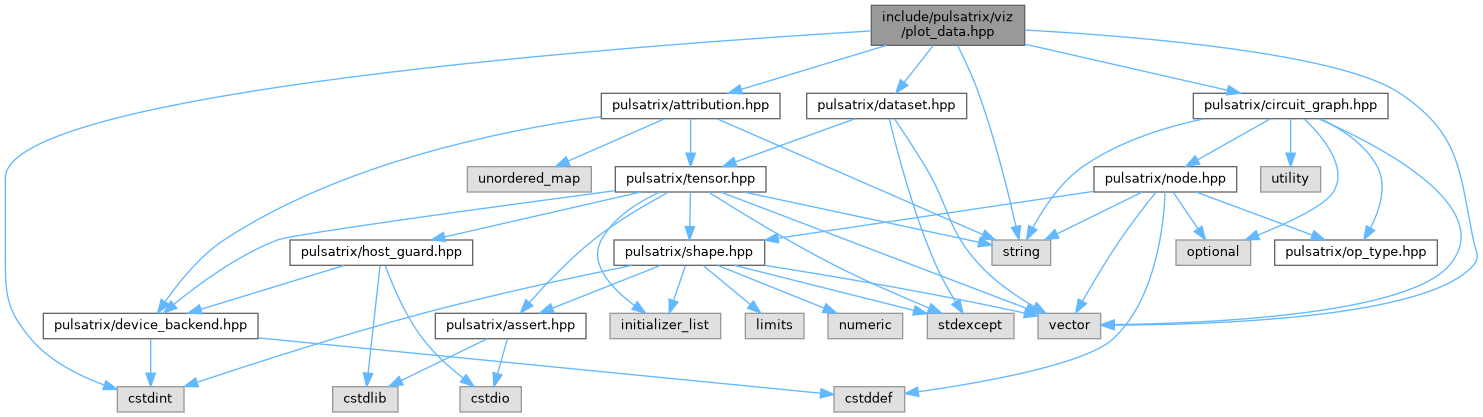
Go to the source code of this file.
Classes | |
| struct | pulsatrix::BarSeries |
| One feature-importance bar: a label and a signed value (sign carries direction). More... | |
| struct | pulsatrix::WaterfallStep |
| One waterfall step: a labeled delta and the running cumulative value after it. More... | |
| struct | pulsatrix::WaterfallBar |
| One floating waterfall bar: spans [bottom, top] on the value axis. More... | |
| struct | pulsatrix::HeatmapGrid |
| A row-major 2D grid of unsigned magnitude values, ready for a heatmap plot. More... | |
| struct | pulsatrix::HeatmapColorScale |
| The color-scale range and colormap family a heatmap's values call for. More... | |
| struct | pulsatrix::BeeswarmPoint |
| One beeswarm point: the attribution value (x) and a collision-avoidance vertical offset (y). More... | |
| struct | pulsatrix::HistogramBins |
| Equal-width histogram bins: rows.size() == counts.size() + 1 edges. More... | |
| struct | pulsatrix::RgbImageBuffer |
| An interleaved-RGB, row-major byte buffer ready for a texture upload. More... | |
Namespaces | |
| namespace | pulsatrix |
Functions | |
| BarSeries | pulsatrix::ToFeatureImportanceBars (const Attribution &attr, int top_k) |
| Converts an Attribution's per-feature values into labeled, magnitude-sorted bars for a horizontal bar chart – the canonical XAI feature-importance encoding (hc_information_visualization.md SS5: position on a shared axis, Cleveland-McGill rank 1). | |
| std::vector< WaterfallStep > | pulsatrix::ToWaterfallSteps (const Attribution &attr, float baseline_value) |
| Converts an Attribution's per-feature values into a cascading waterfall from a real baseline to the final prediction (hc_information_visualization.md SS5/SS6: the one case where a bar chart legitimately does not start at zero, since the baseline itself is the meaningful reference point – Tufte's lie-factor rule is satisfied relative to that baseline, not to zero). | |
| std::vector< WaterfallBar > | pulsatrix::ToWaterfallBars (const std::vector< WaterfallStep > &steps, float baseline_value) |
| Converts waterfall steps into floating bars, each spanning from the previous running total to its own running total – i.e. bar i covers [min(c_{i-1}, c_i), max(c_{i-1}, c_i)] with c_{-1} = baseline_value. Correct for any sign of baseline or running total: a cascade that starts below zero, crosses zero, or stays negative (e.g. explaining a negative logit) floats exactly where the running total is, rather than being anchored at zero the way stacked bar segments are. | |
| HeatmapGrid | pulsatrix::ToSaliencyHeatmap (const Attribution &attr) |
| Reshapes an Attribution's values into a 2D grid for a saliency overlay heatmap. | |
| HeatmapColorScale | pulsatrix::ComputeHeatmapColorScale (const HeatmapGrid &grid) |
| Chooses a heatmap's color scale from its values (hc_information_visualization.md SS4: sequential maps for unsigned magnitude, diverging maps centred on the meaningful midpoint – zero – for signed quantities). | |
| std::vector< BeeswarmPoint > | pulsatrix::ToBeeswarmPoints (const std::vector< Attribution > &runs, int64_t feature_index) |
| Converts one feature's attribution value across many repeated/independent runs into jittered (x, y) points for a beeswarm plot – the global-explanation distribution view (hc_information_visualization.md SS5: "SHAP beeswarm plot...
each point is one prediction; x-position is the SHAP value"). Deterministic, density-based jitter: points are binned along x, then colliding points within a bin are alternately offset above/below y=0 so they read as spread rather than overlapping – not a random jitter, so two calls with the same input always produce the same layout. | |
| std::string | pulsatrix::CircuitNodeDisplayLabel (const CircuitNode &node) |
| Human-readable label for a CircuitGraph node: the node's own label when it has one, otherwise its operation type and id (e.g. "Conv #1", "Activation #2") – so an unlabeled ComputationGraph still renders as a readable layer diagram rather than a row of anonymous "node_<id>" markers. | |
| HistogramBins | pulsatrix::ToFieldHistogramBins (const Dataset &dataset, int64_t field_index, int num_bins) |
| Bins one Sample field's values (flattened across every sample's Tensor at that field position, mirroring DatasetValidator's aggregation convention) into num_bins equal-width bins, for a per-field distribution histogram (hc_information_visualization.md's data-preview touchpoint). | |
| RgbImageBuffer | pulsatrix::ToRgbImageBuffer (const Tensor &image_chw) |
| Converts a decoded image Tensor into an interleaved-RGB byte buffer for GPU texture upload (the data-preview "image grid" touchpoint's pure half – the actual glTexImage2D call lives in TextureCache, which is GL-dependent and untestable here). | |
Pure Attribution/Dataset -> plot-ready-array transforms (no ImGui/ImPlot include).
 1.9.8
1.9.8