 |
pulsatrix 1.1.0
|
|
pulsatrix 1.1.0
|
Turning a persistence diagram into numbers for probes, statistics and plots: Betti curves, persistence landscapes, persistence images and persistent entropy. More...
#include <cstdint>#include <vector>#include "pulsatrix/tda/diagram_distance.hpp"#include "pulsatrix/tda/persistence_diagram.hpp"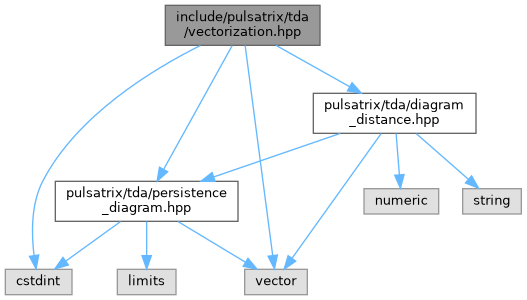
Go to the source code of this file.
Classes | |
| struct | pulsatrix::PersistenceLandscape |
| PersistenceLandscape()'s result: layers[k][i] is lambda_{k+1}(grid[i]). More... | |
| struct | pulsatrix::PersistenceImageOptions |
| ComputePersistenceImage()'s settings. More... | |
| struct | pulsatrix::PersistenceImage |
| A persistence image: values[row * width + column], row 0 at persistence 0. More... | |
Namespaces | |
| namespace | pulsatrix |
Functions | |
| std::vector< double > | pulsatrix::LinearGrid (double start, double stop, int64_t n) |
| n evenly spaced values from start to stop, both included (n >= 2), or {start} for n == 1. | |
| std::vector< int64_t > | pulsatrix::BettiCurve (const PersistenceDiagram &diagram, const std::vector< double > &grid) |
| The Betti curve: how many features are alive, birth <= t < death, at each scale t. | |
| Certified< PersistenceLandscape > | pulsatrix::ComputePersistenceLandscape (const PersistenceDiagram &diagram, const std::vector< double > &grid, int64_t layers=5) |
The first layers persistence landscape functions (Bubenik, JMLR 2015) on a grid: lambda_k(t) is the k-th largest of max(0, min(t - b, d - t)) over the finite points. | |
| PersistenceImage | pulsatrix::ComputePersistenceImage (const PersistenceDiagram &diagram, const PersistenceImageOptions &options={}) |
| The persistence image (Adams et al., JMLR 2017): each finite point (b, d) placed at (b, d - b), weighted by its persistence divided by persistence_max (so features near the diagonal count for little), and spread by a Gaussian; each pixel holds the integral over it, so a pixel's value doesn't depend on the resolution's sampling. | |
| double | pulsatrix::PersistentEntropy (const PersistenceDiagram &diagram) |
| Persistent entropy (Chintakunta et al. 2015; Rucco et al. 2016): the Shannon entropy, in nats, of the finite points' persistences divided by their sum. 0 for one point; log n for n points of equal persistence; 0 for an empty diagram. | |
Turning a persistence diagram into numbers for probes, statistics and plots: Betti curves, persistence landscapes, persistence images and persistent entropy.
A diagram is a multiset of points, which a classifier or a t-test can't take directly. These map it to fixed-size vectors. They differ in what they keep and in how stable they are:
| Vectorization | Stable under | Certified here |
|---|---|---|
| Persistence landscape | the bottleneck distance, 1-Lipschitz in the sup norm (Bubenik 2015) | yes |
| Persistence image | the 1-Wasserstein distance (Adams et al. 2017) | no |
| Betti curve | nothing useful: one point crossing a grid value changes it by 1 | no |
| Persistent entropy | not in general | no |
Essential features (infinite death) are left out of every one of them except the Betti curve, where they count as alive from their birth on. Report how many there were alongside.
 1.9.8