Attribution Graph Viewers
An attribution graph shows how a prediction is built up through the layers of a network. pulsatrix writes graphs in the JSON format that Neuronpedia's graph viewer and Anthropic's circuit-tracer read, so a large graph gets a mature, interactive viewer with no extra code. The viewer lets you click a node to see what feeds it and what it feeds, prune weak nodes with a slider, and pin nodes into a subgraph.
From a language model. pulsatrix_explain_text --graph explains the next-token prediction
with AttnLRP, the same as the token view, and records the relevance at every layer:
pulsatrix_explain_text MODEL_DIR "The Eiffel Tower is located in the city of" \
    --graph eiffel.json --viewer-dir graphs/
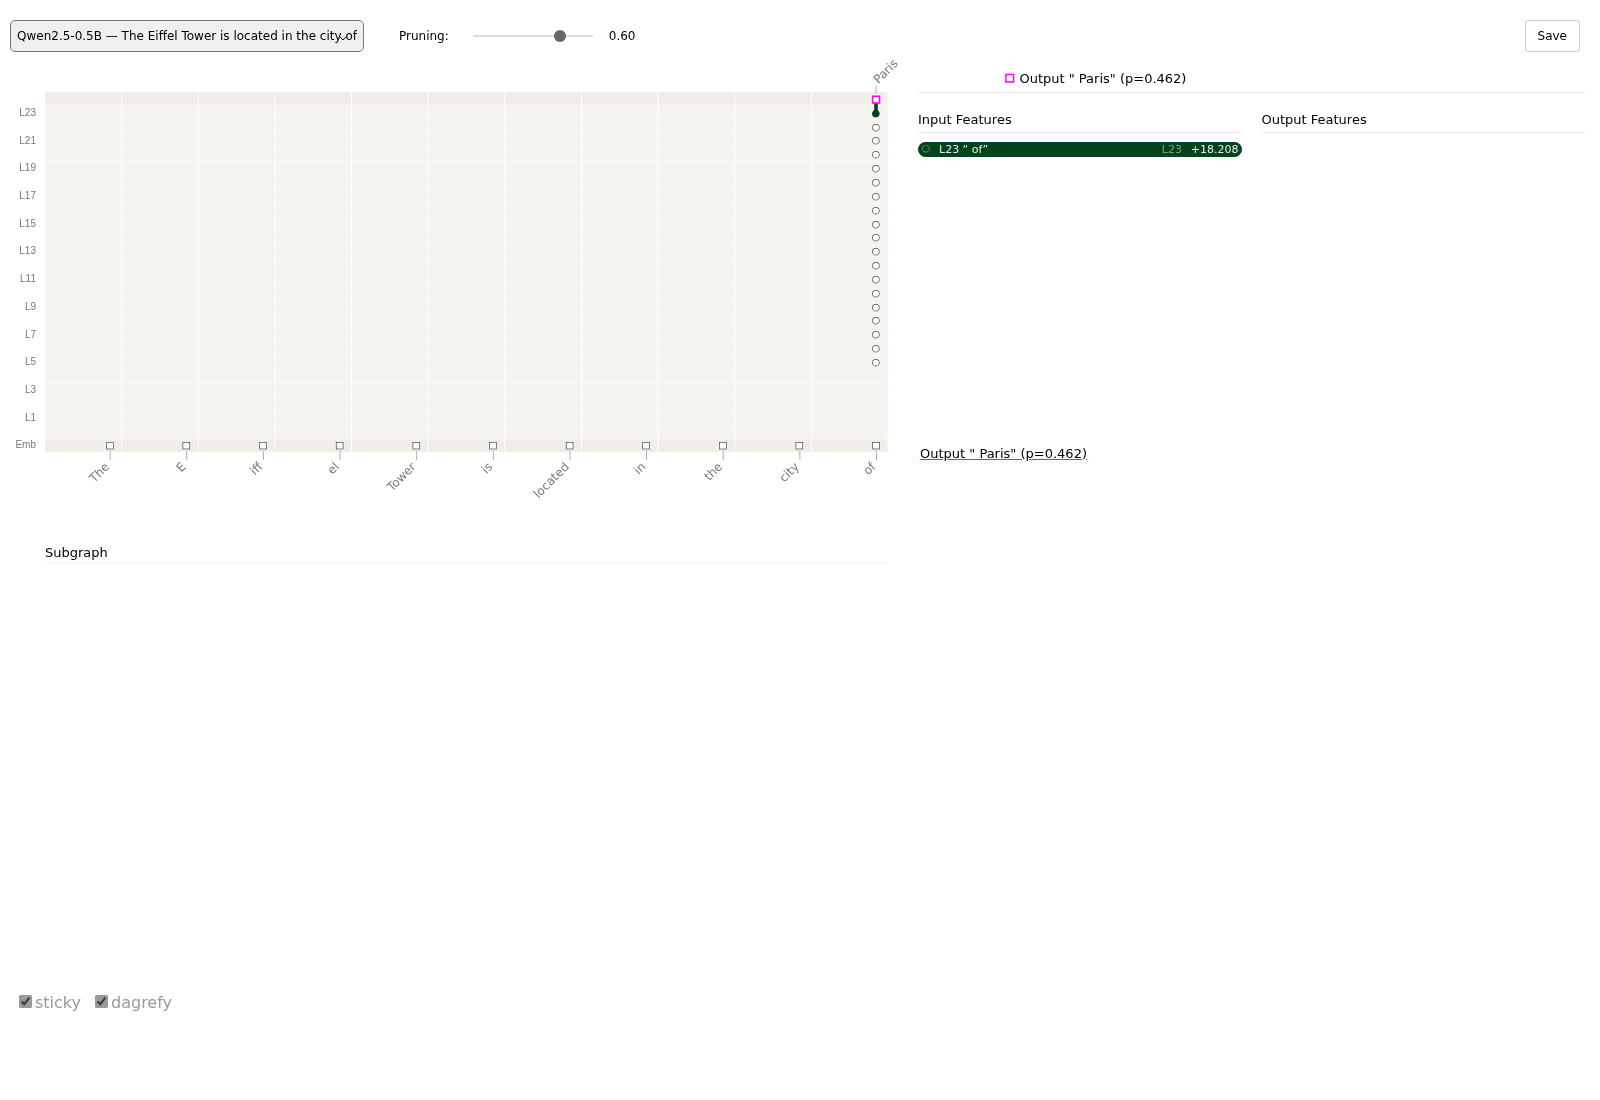
- Nodes.
- One per token at the bottom (the embeddings).
- One per token for the residual stream after each layer.
- The predicted token at the top, with its probability.
A node's activation is its relevance for the prediction.
- Links. A link from token i in one layer to token j in the next is the share of j's
relevance that the layer passes back to i. Links between different tokens are attention
moving information; a token's own vertical path is its residual stream. The links leaving a
node add up to that node's relevance, and the bottom row matches the token view exactly.
- Pruning. By default the file keeps the fewest links holding 98% of the relevance
(--edge-threshold). Each node's influence lets the viewer's slider hide the least relevant
nodes.
- Cost. One block pass per layer and token: about 5 seconds for an 11-token prompt on
Qwen2.5-0.5B on a CPU. Prompts longer than 256 tokens are refused.
- What the nodes are not. Nodes are residual-stream positions, not interpretable features;
this graph shows where the information flows. For a graph whose nodes are transcoder features,
add --transcoders DIR (Attribution graphs).
In C++, BuildRelevanceGraph(model, backend, ids, target, options) (relevance_graph.hpp)
returns the graph, and ToNeuronpediaJson (viz/attribution_graph.hpp) writes it.
From a circuit graph. The ablation-scored circuit_graph.v1 documents export too. The input
is in one column and the operations, in order, are in the next:
pulsatrix_svg circuit.json --neuronpedia --slug my-mlp --scan my-model -o my-mlp.json
Viewing a graph.
- Locally, with circuit-tracer.
--viewer-dir DIRwrites the graph's entry intoDIR/graph-metadata.json, the index circuit-tracer's local viewer reads. Put the graph files in the same directory and start its server there (circuit-tracer start-server --graph_file_dir DIR). Openhttp://127.0.0.1:8041/index.html?slug=SLUG. Use127.0.0.1rather thanlocalhost, because onlocalhostthe viewer loads Anthropic's hosted example graphs instead. - On Neuronpedia. Upload the file at
neuronpedia.org/graph/validator. Neuronpedia
uses
scanas its model id.
Every file is written against Neuronpedia's graph-schema.json. Before writing,
ToNeuronpediaJson checks that node ids are unique, that links name real nodes, that numbers
are finite, and that the output node's label carries its probability, which the viewer reads.
ParseNeuronpediaGraph reads graphs that circuit-tracer or Neuronpedia wrote.