Desktop Windows (Dear ImGui)
Native windows with charts, dashboards and live views, built on Dear ImGui and ImPlot
(immediate-mode GUI and plotting libraries). They are optional: build with
-DPULSATRIX_ENABLE_VIZ=ON (see below). Each widget
draws the same data as the JSON documents, so a figure can also be saved and drawn elsewhere.
| Widget | Shows | Also draws |
|---|---|---|
AttributionBarChart |
Top features of one attribution, as bars | AttributionDocument |
AttributionWaterfallChart |
How features move the output from the baseline to the prediction | AttributionDocument |
AttributionBeeswarmView |
One feature's attribution across many inputs | — |
SaliencyHeatmapView |
An attribution as a 2D heatmap with a color scale | HeatmapDocument |
CircuitGraphView |
A CircuitGraph's per-node ablation effect |
CircuitGraphDocument |
ConfidenceMeter |
A confidence value as a labeled bar | — |
ExplanationScoreCard |
One panel: prediction, top features, confidence, and trust checks (ComputeConservation, ComputeAttributionStability) |
— |
DatasetStatisticsView |
Per-field histograms of a dataset | — |
ImageGridView |
A grid of image thumbnails with captions | — |
TrainingDashboard, ImPlotMetricsSink::Draw() |
Live training curves | a saved training_log.v1, after ReplayTrainingLog |
TokenRelevanceView |
Text with each token or word colored by its relevance, with the score on hover | TokenRelevanceDocument |
Infrastructure. VizWindow (viz/window.hpp) owns the window, the OpenGL context, and the
ImGui/ImPlot setup. You write a per-frame draw callback and call window.run(...).
TextureCache uploads images to the GPU once and reuses them across frames.
Building with visualization enabled
Prerequisites
The default build has no GUI dependencies. -DPULSATRIX_ENABLE_VIZ=ON adds these:
- Network access at configure time. CMake downloads GLFW 3.4, Dear ImGui v1.92.5, and
ImPlot v0.17 with
FetchContent. - OpenGL development files. CMake runs
find_package(OpenGL REQUIRED). On Debian/Ubuntu, installlibgl1-mesa-dev. - GLFW's build dependencies on Linux. GLFW 3.4 builds X11 and Wayland support by default.
On Debian/Ubuntu, install
libx11-dev libxrandr-dev libxinerama-dev libxcursor-dev libxi-devfor X11, andlibwayland-dev libxkbcommon-dev wayland-protocolsfor Wayland. To skip Wayland, add-DGLFW_BUILD_WAYLAND=OFF. - A display and a GPU driver to run anything that links
pulsatrix_viz. That is why the option defaults toOFFand CI builds without it. - Optional: FreeType and fontconfig, for text in every language (see
Fonts and languages). On Debian/Ubuntu, install
libfreetype-dev libfontconfig1-dev. CMake uses them when it finds them. Without them the windows still work, using stb_truetype and a list of common font files.
Fonts and languages
The windows show text in any language your system has fonts for: Chinese, Japanese, Korean,
Cyrillic, Greek, Arabic, Hebrew, Indic scripts, Thai, Georgian, Armenian, Ethiopic, math symbols,
emoji and more. A VizWindow starts from Dear ImGui's default font and merges system fonts in
behind it, so the default look doesn't change. A fallback font is used only for characters the
fonts before it lack, and each glyph is drawn the first time it's needed.
How the fonts are found:
- Linux with fontconfig: about forty sample characters, one per script plus symbols, math and emoji, are each matched to the best installed font. That's typically 20 to 30 fonts, and it adds about 0.1 s and 30 MB at startup.
- Windows and macOS: the fonts that ship with the system (Segoe UI, Microsoft YaHei, Nirmala UI, Segoe UI Emoji, ...; Helvetica, PingFang, Arial Unicode, ...).
- Linux without fontconfig: common Noto and DejaVu files in the usual font directories.
To choose fonts yourself, set PULSATRIX_VIZ_FONTS to font files, separated by : (; on
Windows). They come first, before the system fonts. Set it to none to use only ImGui's default
font. In code, pass a VizFontOptions to the VizWindow constructor:
VizFontOptions fonts;
fonts.fonts = {{"/path/to/MyFont.ttf"}};  // first in line, before the system fonts
fonts.size = 18.0f;                      // pixels; ImGui's default is 13
VizWindow window("my app", 1280, 800, fonts);
Emoji. Emoji are drawn in color with a vector color font, such as Segoe UI Emoji (Windows)
or Twemoji, when FreeType is available. Bitmap emoji fonts can't be scaled, so they are skipped.
That covers Noto Color Emoji (the usual one on Linux) and Apple Color Emoji. On Linux, install
a vector emoji font for color (for example Twemoji, from mozilla/twemoji-colr) and point
PULSATRIX_VIZ_FONTS at it. Without one, emoji fall back to black-and-white glyphs where a text
font has them.
Scripts that need text shaping. Dear ImGui places characters one after another. It can't join
Arabic letters, lay out right-to-left text, or reorder and combine the vowel signs and conjuncts
of Indic scripts, and a ligature such as an emoji with a skin tone shows as two glyphs. For these
scripts every character appears, but not as a reader would write them. The SVG figures don't have
this limit: the browser or SVG viewer shapes the text. TokenRelevanceView is fine for reading
scores, and the SVG strip (pulsatrix_explain_text ... -o out.svg) shows the text itself
correctly.
Build
cmake -S . -B build -DPULSATRIX_ENABLE_VIZ=ON
cmake --build build --target training_dashboard_demo --config Release
Link your own executable against pulsatrix_viz. It brings in pulsatrix_core, imgui, and
implot, including their include directories:
add_executable(my_viz_app my_viz_app.cpp)
target_link_libraries(my_viz_app PRIVATE pulsatrix_viz)
pulsatrix_viz isn't installed, so use it from a source tree (add_subdirectory). An installed
find_package(pulsatrix) gives you pulsatrix::core, which includes the JSON documents and the
SVG renderer.
The data transforms, ImPlotMetricsSink's logging methods, the JSON documents and the SVG
renderer need no flag. They are always
part of pulsatrix_core.
Demo apps
| Target | What it shows |
|---|---|
training_dashboard_demo |
Live loss curves while an XOR network trains |
explanation_dashboard_demo |
Bar chart, waterfall, saliency heatmap, circuit graph, and score card for a small XOR network |
dataset_preview_demo |
DatasetStatisticsView and ImageGridView on small synthetic datasets |
live_inference_demo |
An ExplanationScoreCard that updates as it cycles through XOR inputs |
token_relevance_demo |
TokenRelevanceView on token relevance documents, for example from pulsatrix_explain_text |
mnist_viz_gallery |
Every widget on MNIST digits (see below) |
How to implement
A live training dashboard
#include <imgui.h>

#include "pulsatrix/adam_optimizer.hpp"
#include "pulsatrix/cpu_backend.hpp"
#include "pulsatrix/viz/training_dashboard.hpp"
#include "pulsatrix/viz/window.hpp"
#include "pulsatrix/xor_training_example.hpp"

using namespace pulsatrix;

CPUBackend backend;
XorNetwork net(&backend);
AdamOptimizer optimizer(0.05f, &backend);
ImPlotMetricsSink sink;  // a MetricsSink that buffers logged values for plotting

// The four XOR examples, as (1, 2) inputs and (1, 1) targets.
const float xs[4][2] = {{0, 0}, {0, 1}, {1, 0}, {1, 1}};
const float ys[4] = {0, 1, 1, 0};
int step = 0;

VizWindow window("Training Dashboard", 1000, 700);
window.run([&]() {
    for (int i = 0; i < 4 && step < 4000; ++i, ++step) {   // a few training steps per frame
        Tensor input(Shape({1, 2}), &backend, {xs[step % 4][0], xs[step % 4][1]});
        Tensor target(Shape({1, 1}), &backend, {ys[step % 4]});
        net.train_step(input, target, optimizer, sink, step);  // logs the loss to sink
    }
    ImGui::Begin("Training Dashboard");
    TrainingDashboard::Draw(sink);
    ImGui::End();
});
Full source: examples/viz/training_dashboard_demo.cpp.
What's happening: XorNetwork::train_step() and MnistConvNet::train_step() take a
MetricsSink&. Passing an ImPlotMetricsSink adds plotting with no change to the training
code. Each frame, TrainingDashboard::Draw() reads the sink's per-tag series. It draws a
one-line summary per tag (last, min, max, current step) and a small line chart for each tag.
Logging and drawing are separate methods. The logging half works, and is unit-tested, even
with PULSATRIX_ENABLE_VIZ=OFF. Only Draw() needs the GUI stack.
Recipe: Training dashboard.
MNIST gallery
mnist_viz_gallery runs every widget on this page against MNIST test digits:
python3 tools/fetch_mnist.py              # once: data/MNIST/raw/ (gitignored)
cmake -S . -B build-viz -DPULSATRIX_ENABLE_VIZ=ON -DCMAKE_BUILD_TYPE=Release
cmake --build build-viz --target mnist_viz_gallery -j
./build-viz/mnist_viz_gallery                          # interactive
./build-viz/mnist_viz_gallery --screenshot out/        # one PNG per page, then exit
Run it from the repository root, or pass --data DIR (default data/MNIST/raw).
| Option | Meaning | Default |
|---|---|---|
--epochs N |
Training epochs | 1 |
--train N |
Training digits (about 25 s per epoch on one CPU core at the default) | 60000 |
--images N |
Test digits explained with every method. If none is misclassified, the first misclassified test digit is added. | 4 |
--eval N |
Held-out digits for the accuracy curve | 2000 |
--beeswarm N |
Digits behind each beeswarm | 200 |
--screenshot DIR |
Save one PNG per page to DIR, then exit |
off |
| Page | Widgets | What it shows |
|---|---|---|
| Training | ImPlotMetricsSink, TrainingDashboard |
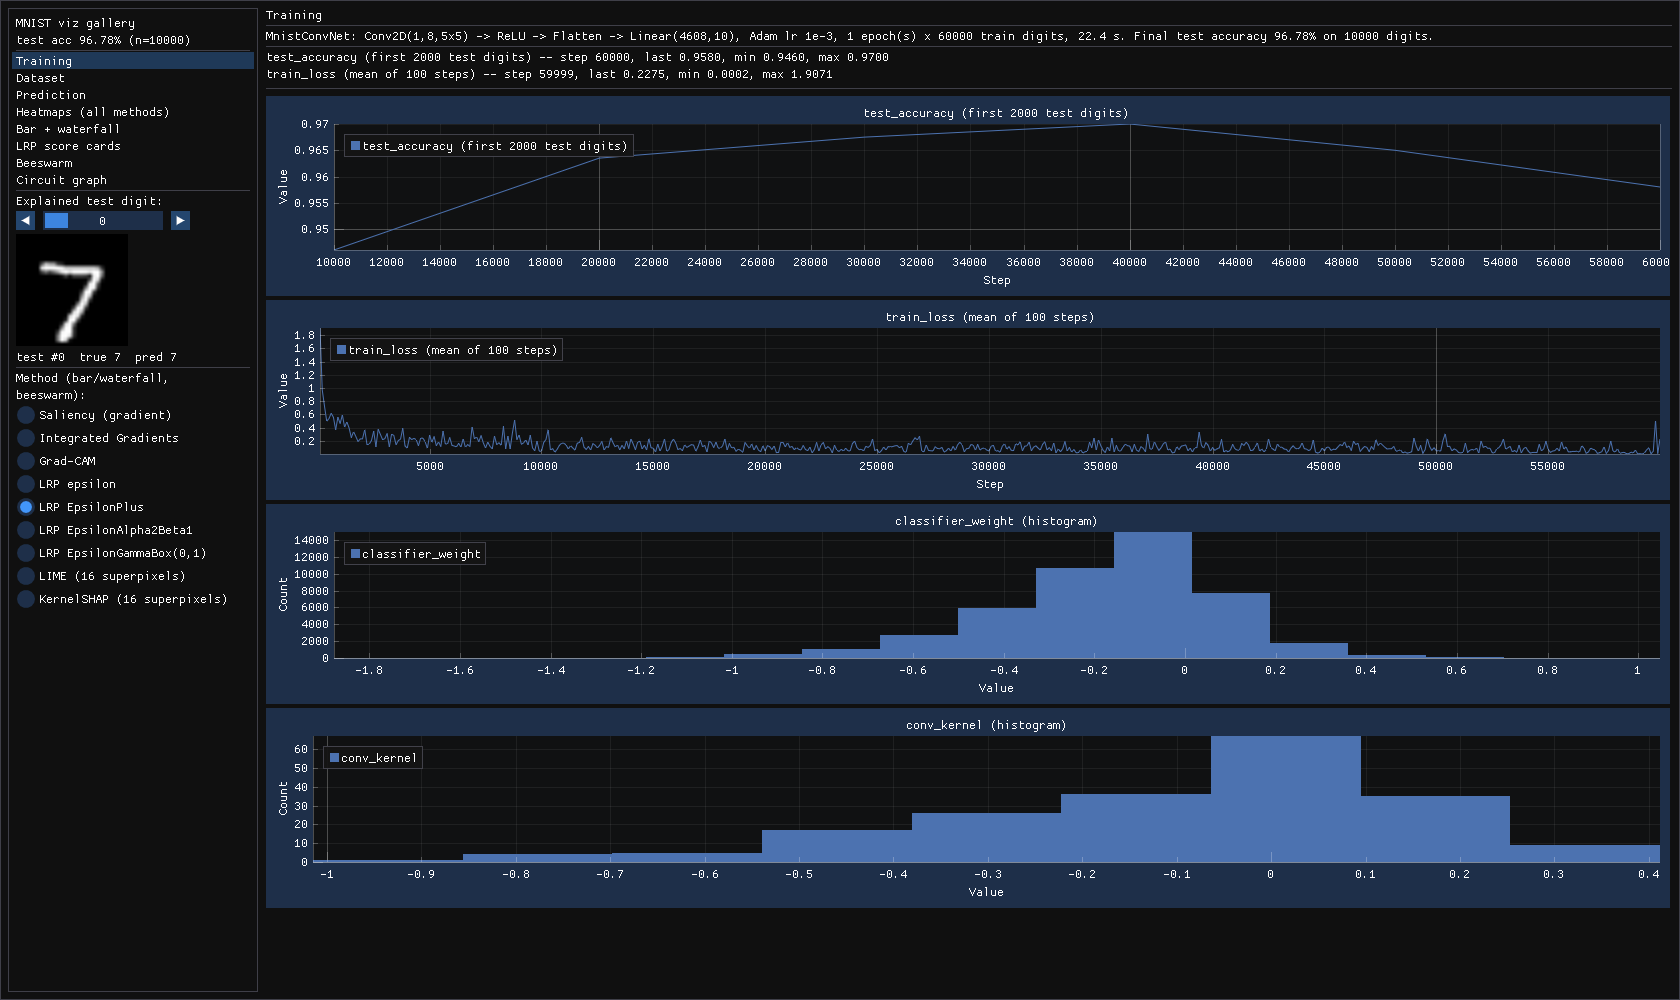
MnistConvNet (Conv2D(1,8,5x5) -> ReLU -> Flatten -> Linear) training live: 100-step mean loss, held-out accuracy, final conv-kernel and classifier-weight histograms |
| Dataset | DatasetStatisticsView, ImageGridView, TextureCache |
Pixel and label histograms of the first 1000 test digits; 32 test digits captioned with true and predicted label |
| Prediction | ConfidenceMeter |
10-class softmax of the selected digit |
| Heatmaps | SaliencyHeatmapView |
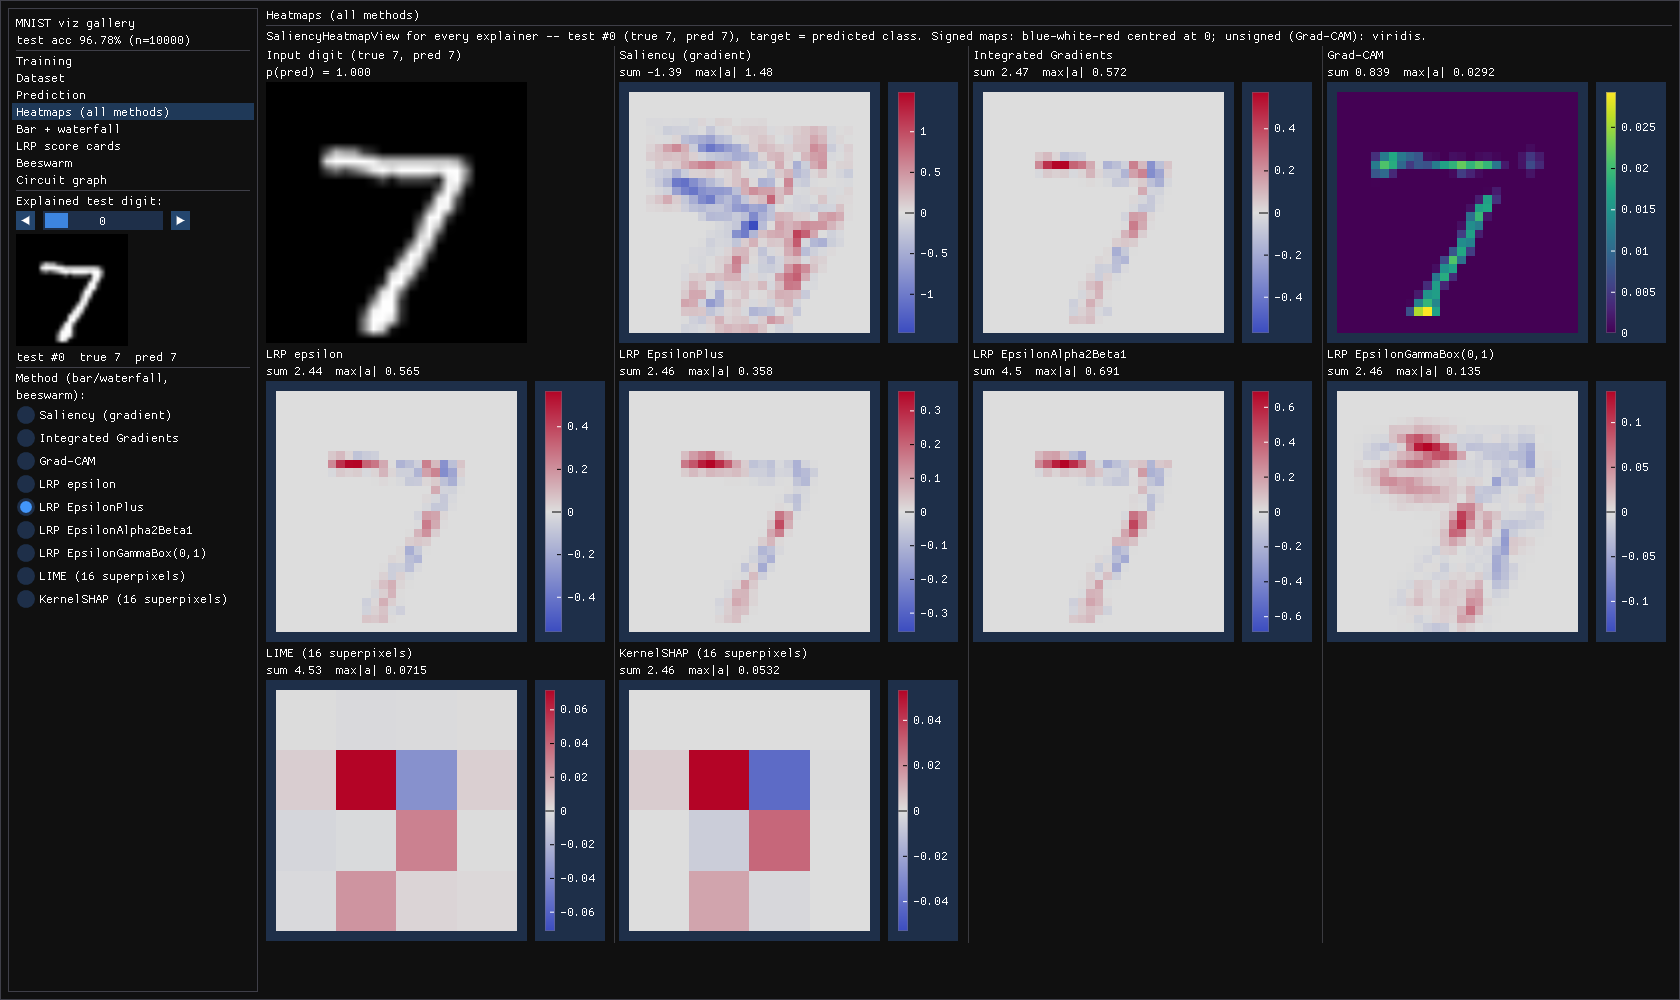
Saliency, IG, Grad-CAM, LRP epsilon / EpsilonPlus / EpsilonAlpha2Beta1 / EpsilonGammaBox(0,1), LIME, KernelSHAP side by side |
| Bar + waterfall | AttributionBarChart, AttributionWaterfallChart |
Top-12 features of the selected method, starting from its reference value (black-image logit for IG/SHAP, 0 otherwise) |
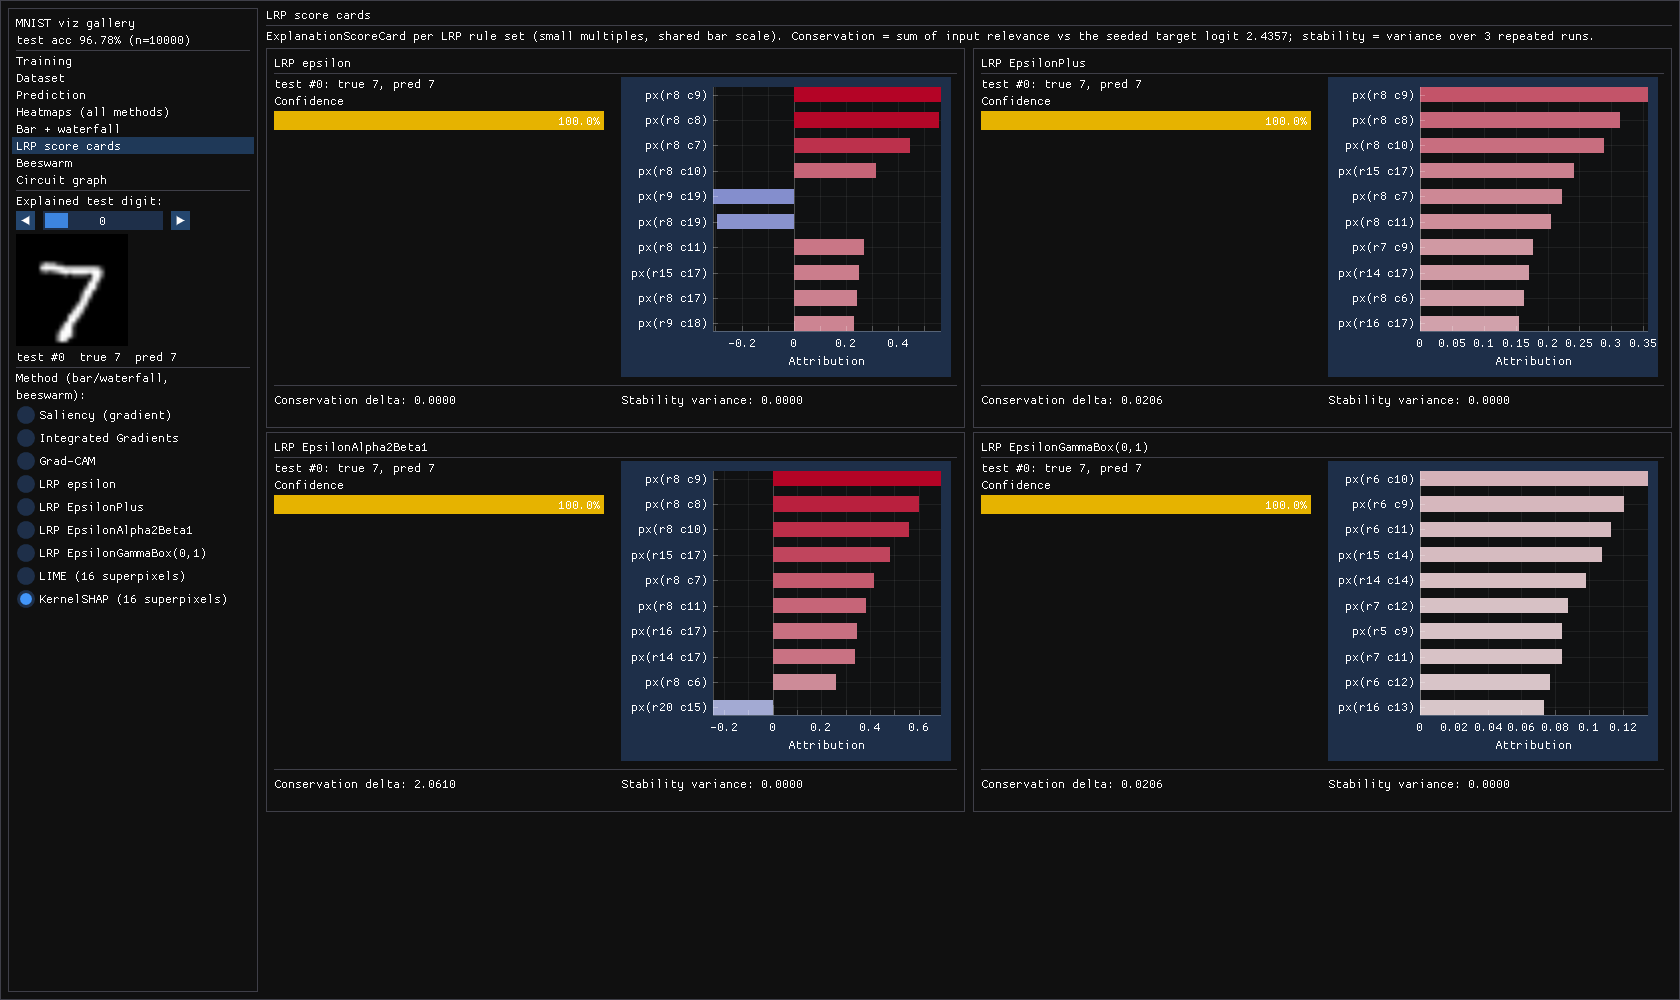
| LRP score cards | ExplanationScoreCard |
One card per LRP rule set, on a shared scale: confidence, top relevance, conservation delta, stability over repeated runs |
| Beeswarm | AttributionBeeswarmView |
The 4 pixels with the highest mean |attribution| across 200 test digits, per gradient/LRP method |
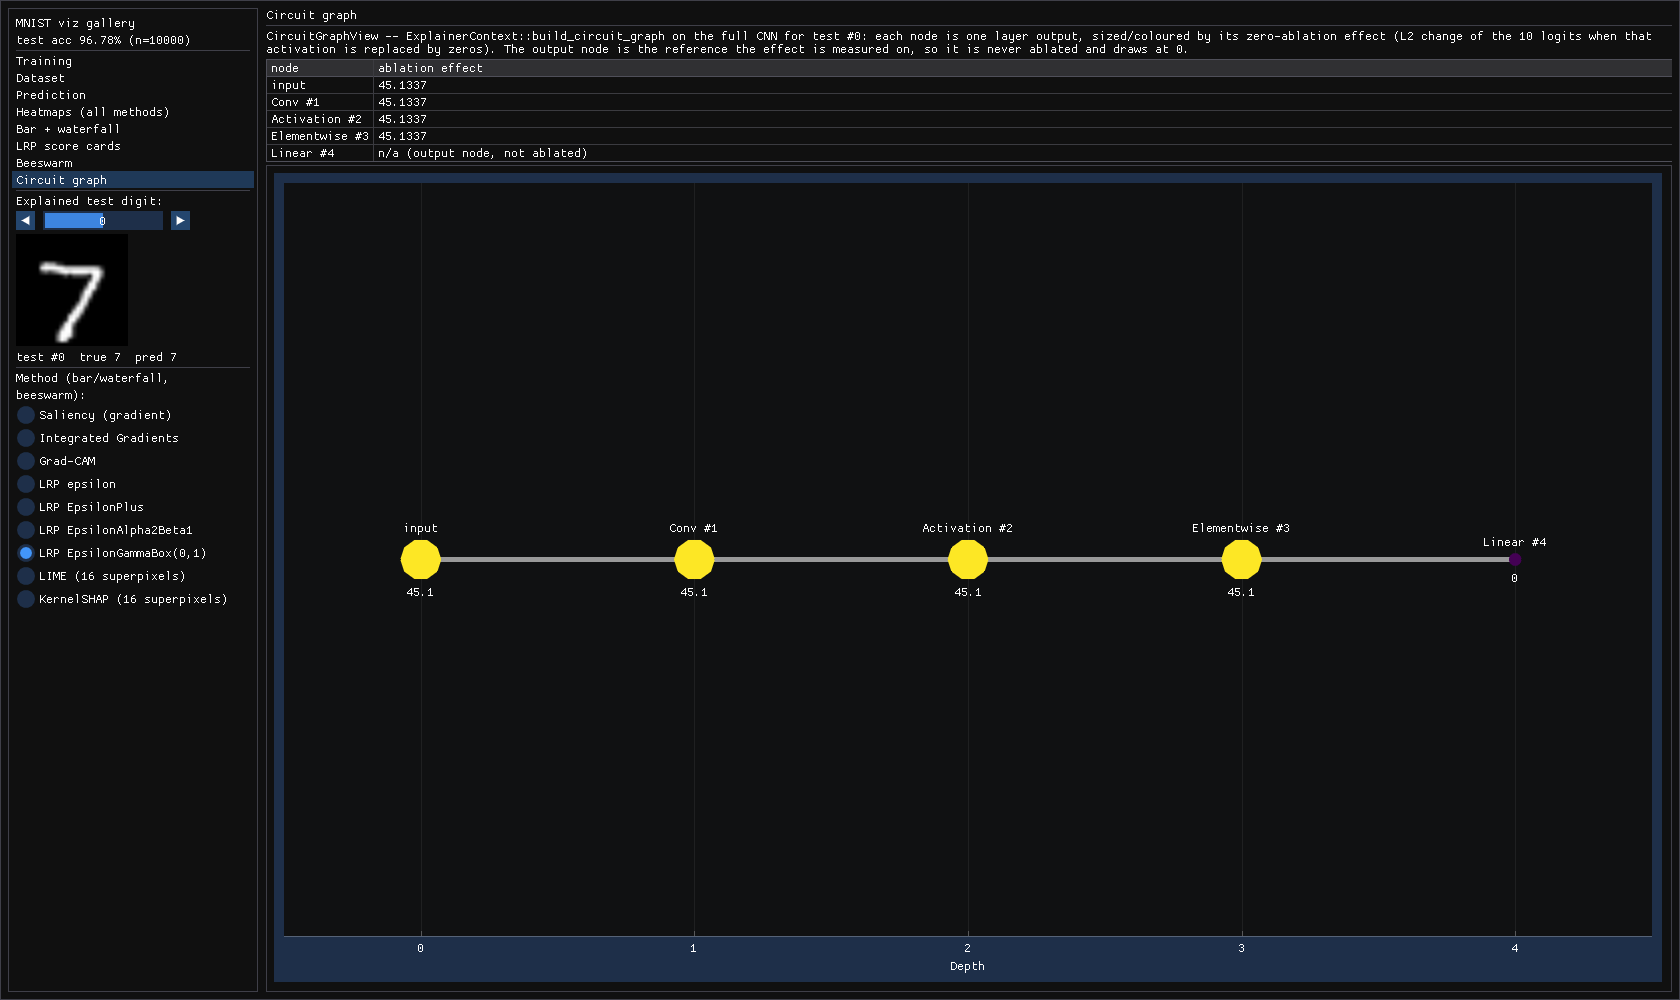
| Circuit graph | CircuitGraphView |
ExplainerContext::build_circuit_graph on the CNN: per-layer zero-ablation effect |
For what the LRP rule names mean, see LRP.
Explainer settings
| Method | Setting |
|---|---|
| Integrated Gradients | 128 steps from a black baseline |
| Grad-CAM | The 24x24 map is zero-padded by 2 px onto the 28x28 grid, so each cell sits at the center of its 5x5 receptive field |
| KernelSHAP | 16 superpixels (a 4x4 grid of 7x7 patches); all 2^16 coalitions enumerated exactly; an absent patch is black |
| LIME | The same 16 superpixels; 2000 samples; sigma 0.5 |
Why LIME uses superpixels
This library's LIME sets its locality kernel width equal to the perturbation sigma. On all 784 pixels, every sample weight underflows to zero, so pixel-level LIME is not meaningful here.
The gallery prints the test accuracy to stdout. For each explainer it also prints the attribution sum, the max |attribution|, and the IG-completeness, SHAP-efficiency, or LRP-conservation check.
Signed attributions use the blue-white-red diverging map, centered on zero. Unsigned ones
(Grad-CAM) use Viridis. SaliencyHeatmapView picks the map via ComputeHeatmapColorScale.
Screenshots
Captured with --screenshot on a model trained for one epoch (96.78% test accuracy), test
digit #0 (a 7):
 |
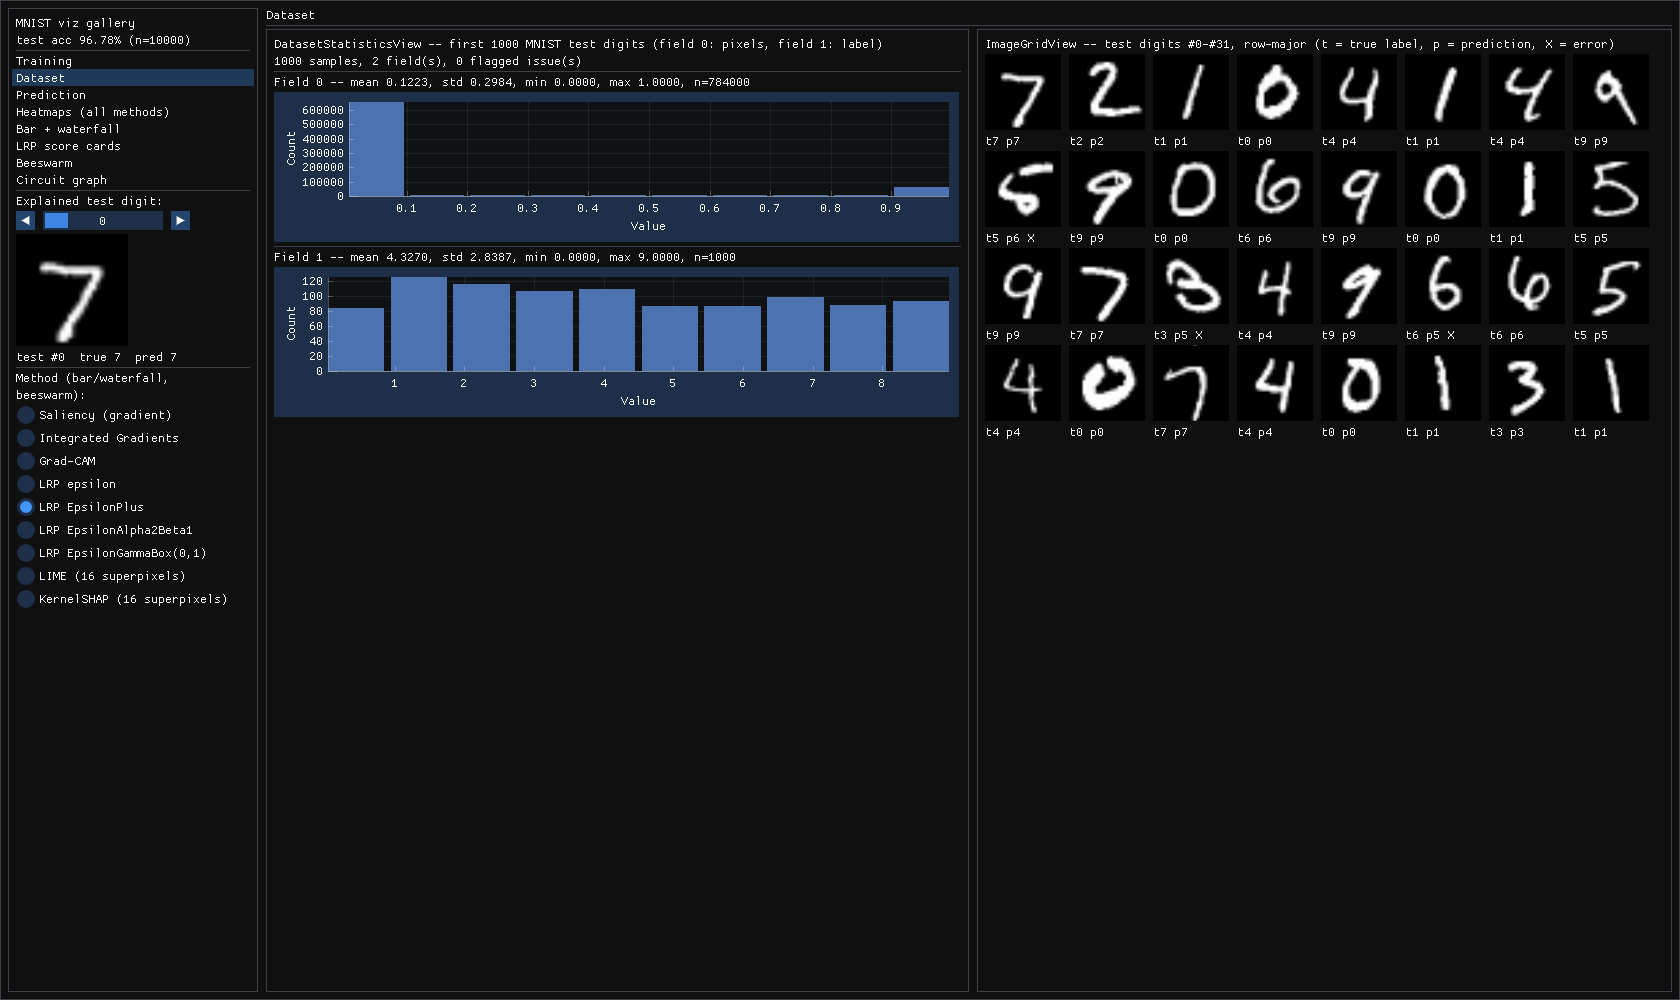 |
| Training: live loss, held-out accuracy, weight histograms | Dataset: pixel/label histograms, captioned test digits (X = misclassified) |
 |
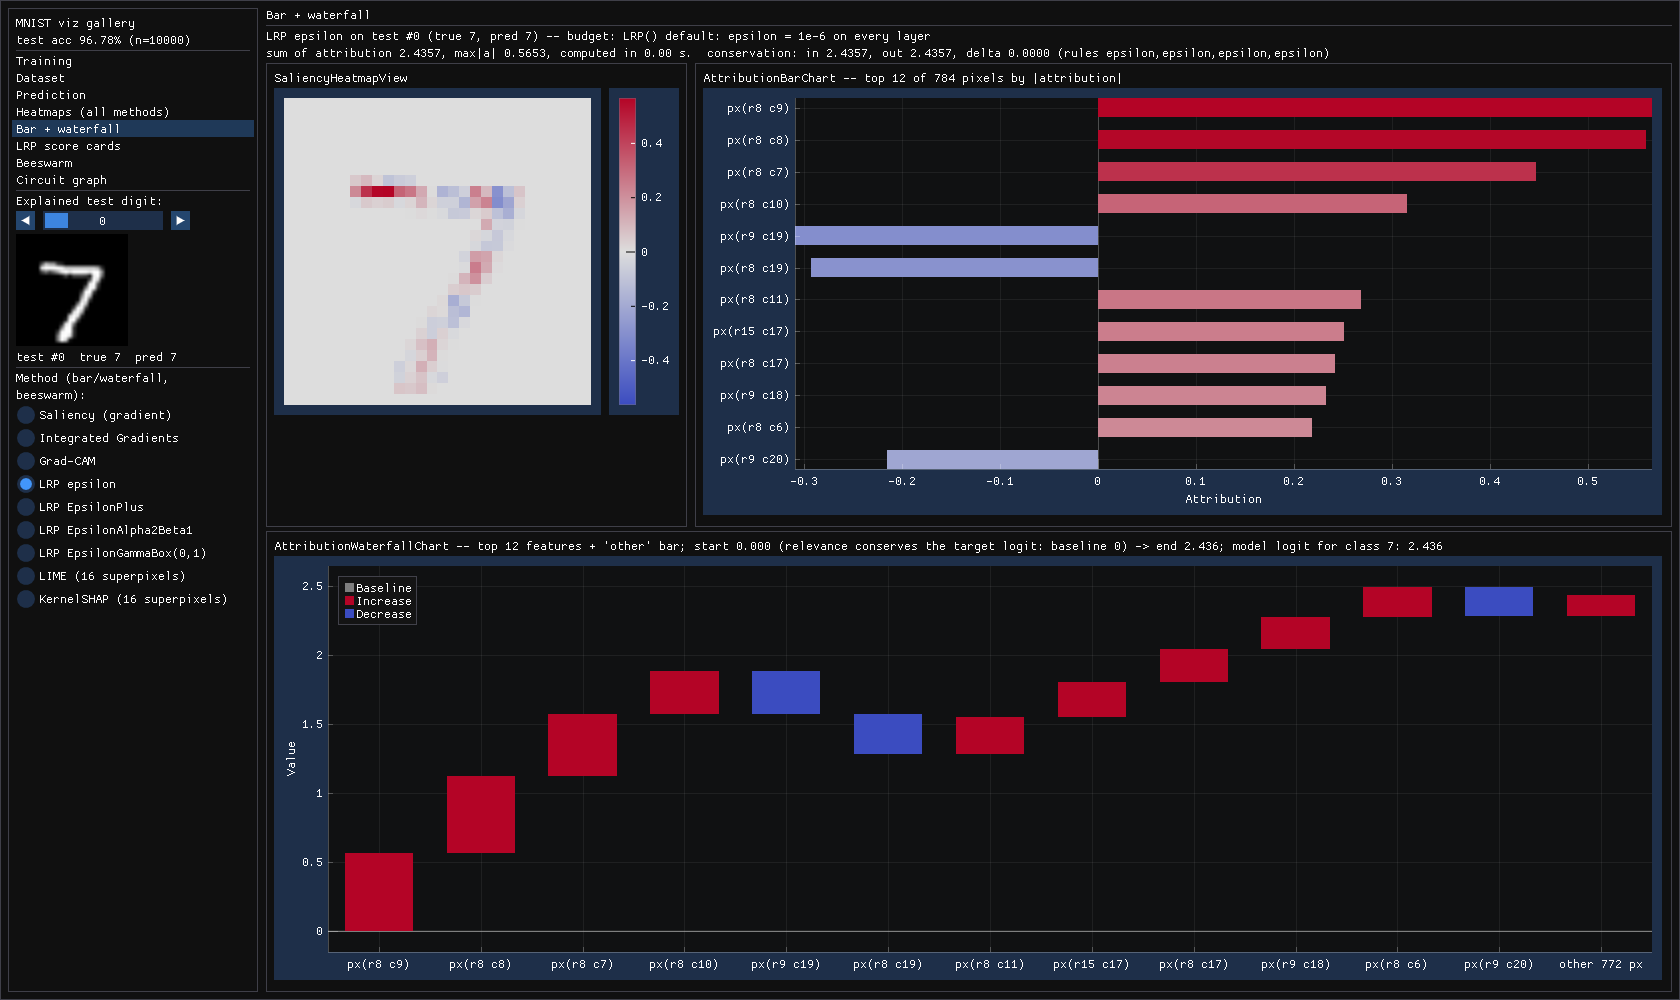 |
| Heatmaps: all nine explainers side by side | LRP epsilon: heatmap, top-12 bars, waterfall to the 2.436 logit |
 |
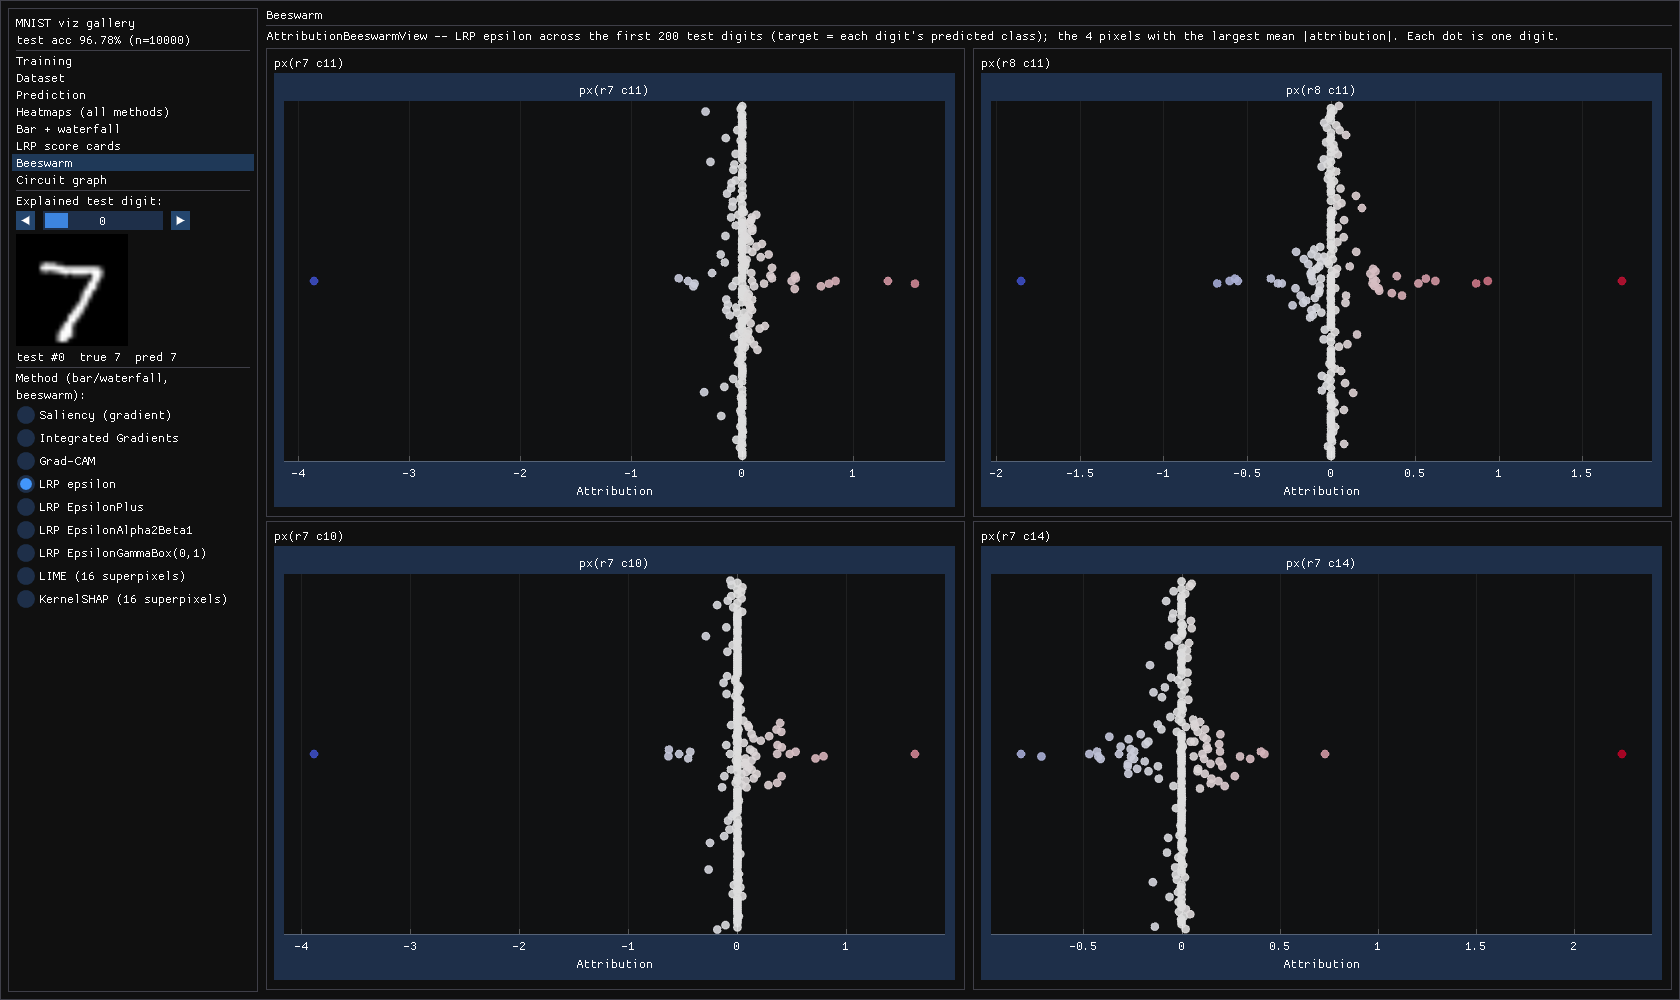 |
| Score cards: one per LRP rule set, conservation and stability | Beeswarm: top-4 pixels across 200 test digits |
 |
|
| Circuit graph: per-layer zero-ablation effect (the output node is the reference, not ablated) |