SVG Figures
For papers, reports and CI, viz/svg.hpp draws documents as standalone SVG files. It needs no
GPU, display, font library or ImGui, and it is part of pulsatrix_core. Colors come from
colormap.hpp, the same as the ImGui widgets: blue-white-red for signed values and Viridis for
magnitudes.
| Function | Draws | From |
|---|---|---|
RenderBarChartSvg(doc, top_k) |
The top features by |attribution|, on an axis through zero | AttributionDocument |
RenderWaterfallSvg(doc, baseline) |
Each feature moving the output from the baseline to the prediction | AttributionDocument |
RenderHeatmapSvg(doc) |
The grid, with a color bar and any row and column labels | HeatmapDocument |
RenderTokenStripSvg(doc) |
The text's tokens, wrapped, each on a background colored by its relevance | TokenRelevanceDocument |
RenderBeeswarmSvg(docs, features) |
One row per feature, one point per input | several AttributionDocuments |
RenderCounterfactualSetSvg(docs) |
Several counterfactuals of one input side by side: a column each, a row per changed feature, cells colored by the change | several CounterfactualDocuments |
RenderMorrisSvg(doc) |
μ* against σ on one scale, a point per feature with μ's interval, and the line σ = μ | MorrisDocument |
RenderSobolSvg(doc, top_k) |
First- and total-order indices per feature, largest total first, with confidence whiskers | SobolDocument |
RenderCounterfactualSvg(doc, max_rows) |
Whether the target is reached, then each changed feature, costliest first, with its old and new value and its change in units of its scale | CounterfactualDocument |
RenderTornadoSvg(doc, top_k) |
One row per feature, largest swing first: bars from the unchanged output to the output at the feature's low and high values | SensitivityDocument |
RenderPartialDependenceSvg(doc, view) |
ICE curves under their average, raw, centered or as slopes, with a rug of the inputs' values | PartialDependenceDocument |
RenderMutationMapSvg(doc) |
Every substitution's score, a row per amino acid and a column per residue, the wild type dotted; long sequences wrap | MutationMapDocument (protein views, viz/protein_views.hpp) |
RenderSequenceLogoSvg(doc) |
A sequence logo: letters stacked to each position's information content | SequenceLogoDocument |
RenderContactMapSvg(doc) |
Predicted contacts above the diagonal; the structure's contacts and the top L predictions, right or wrong, below | ContactMapDocument |
RenderResidueTracksSvg(doc) |
Per-residue tracks and annotated features under the sequence | ResidueTracksDocument |
RenderPersistenceDiagramSvg(doc, view) |
Birth against death per feature, a band of the certified error along the diagonal, essential features on a ∞ line, significant ones filled | PersistenceDiagramDocument (topology views, viz/topology_views.hpp) |
RenderBarcodeSvg(doc, view) |
A bar per feature from birth to death, by dimension and longest first, with ±error-bound whiskers | PersistenceDiagramDocument |
RenderBettiCurveSvg(doc, view) |
The number of features alive at each scale, per dimension | PersistenceDiagramDocument |
RenderReliabilityDiagramSvg(series) |
Each confidence bin's accuracy against its mean confidence, one line per classifier, with the diagonal of perfect calibration, each classifier's ECE, and the share of inputs in each bin below | ClassificationReports (performance views, viz/performance_views.hpp) |
RenderSliceErrorSvg(report, view) |
Each slice's error with its interval, worst first, the whole dataset's error as a dashed line, an optional reference such as a target miss rate, and each slice's p-value; slices worse than the rest in red | SliceErrorReport |
RenderProjectionSvg(doc, x_axis, y_axis) |
Two axes of a projection, such as PC1 and PC2, on one scale: points colored by group (with a legend) or by value (with a color bar), each with its label on hover. UMAP and t-SNE plots get a note that their distances, cluster sizes and densities aren't meaningful | ProjectionDocument |
RenderSeriesSvg(doc, view) |
Lines of measured points, each with an interval whisker, on linear or log axes; panels stacked as small multiples with one legend, a series keeping its color in every panel, and each point's values on hover. view.shared_y gives every panel the same y range |
SeriesDocument (viz/series.hpp) |
#include <fstream>

#include "pulsatrix/viz/svg.hpp"

SvgOptions options;
options.title = "Why the model said yes";
std::ofstream("bars.svg") << RenderBarChartSvg(ToAttributionDocument(attribution), 10, options);
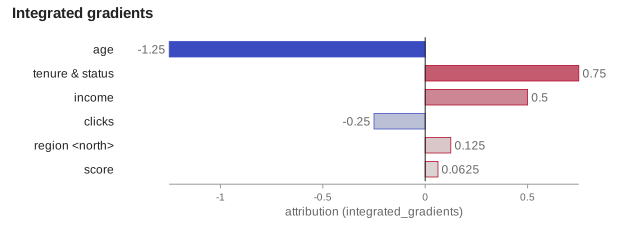
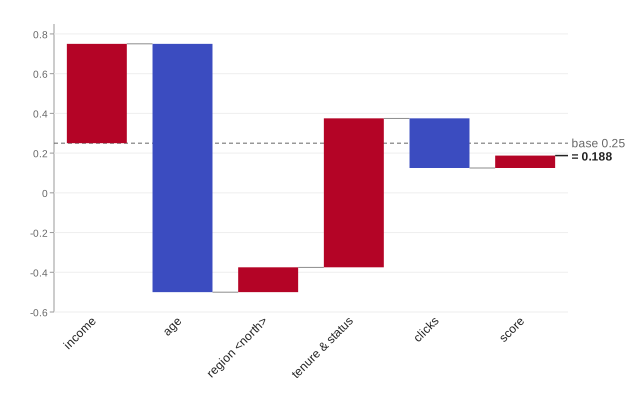
SvgOptions sets the width (default 640 pixels), a title and the font size. The height follows
from the content. Every figure has a title element for screen readers, and every bar, cell and
token has a tooltip with its exact value.
From the command line. The pulsatrix_svg tool, built and installed with the library,
turns documents into figures:
pulsatrix_svg explanation.json -o bars.svg                 # attribution: bar chart
pulsatrix_svg explanation.json --waterfall 0.12 -o wf.svg  # attribution: waterfall
pulsatrix_svg run*.json --beeswarm 0,3,7 -o swarm.svg      # many attributions: beeswarm
pulsatrix_svg saliency.json -o map.svg                     # heatmap
pulsatrix_svg tokens.json -o text.svg                      # token relevance
pulsatrix_svg pd.json --ice centered -o ice.svg            # partial dependence, centered ICE
pulsatrix_svg sens.json --top-k 8 -o tornado.svg           # sensitivity: tornado chart
pulsatrix_svg cf.json -o cf.svg                            # counterfactual: what changed
pulsatrix_svg cf1.json cf2.json cf3.json -o set.svg        # several counterfactuals side by side
pulsatrix_svg morris.json -o morris.svg                    # Morris screening scatter
pulsatrix_svg sobol.json -o sobol.svg                      # Sobol index bars
pulsatrix_svg pca.json --axes 1,3 -o pca13.svg             # projection: PC1 against PC3
pulsatrix_svg ph.json --view barcode --dims 1 -o h1.svg    # persistence: H1 as a barcode
pulsatrix_svg sweep.json -o sweep.svg                      # series: lines with intervals
pulsatrix_svg one.json five.json -o reliability.svg        # classification reports: one reliability diagram
pulsatrix_svg slices.json -o slices.svg                    # slice error: error by slice
Other options: --top-k N, --axes I,J (a projection's axes, from 1), --view diagram|barcode|betti and --dims D,... (a persistence diagram's view and dimensions), --width W, --font-size N, --title TEXT.
Details:
- Deterministic. The same input gives the same bytes on every platform. Tests compare each chart with a stored file.
- Large heatmaps. Grids up to 4,096 cells are one vector rectangle per cell. Larger grids, such as a 224 x 224 saliency map, are embedded as a lossless PNG with sharp pixel edges, which keeps the file small (about 45 KB for 224 x 224).
- Non-finite values. A heatmap cell or token whose value is NaN or infinite is drawn gray and left out of the color scale. The bar, waterfall and beeswarm charts refuse non-finite values, because there's no honest bar length for them.
- Text widths are estimated at 0.6 em per character, since there is no font library. Token strips use a monospace font, so their widths are exact. Long labels are shortened with an ellipsis. For exact layout of any script, use the HTML token view.